Wednesday, January 22, 2014

Dialog Lookup Values For Common Entities

One feature of dialogs is the ability to prompt the user for a record to interact with i.e. prompt for a lookup response.

image

The Reference Entity and Reference Field are two of the least intuitive features of CRM so I thought I would write an article on how they work and some good values to use for them.

How They Work

Essentially, the two fields are used to define a lookup which already exists in CRM so it can be presented to the user, during the dialog, and receive a value.

So, if you are wanting to capture, for example, a Contact record from the user, you could use the Primary Contact lookup (Reference Field) on the Account entity (Reference Entity).

image

This will allow the dialog to prompt the user for a Contact lookup so a Contact can be chosen.

Once this is explained, it actually makes a lot of sense or, at least, is quite easy to use.

Typical Values for the Common Entities

According to the Audit Settings, these are the Common Entities, with some suggested settings for the dialog:

  • Account: Account-Parent Account
  • Contact: Account-Primary Contact
  • Goal: Goal-Parent Goal
  • Goal Metric: Goal-Goal Metric
  • Lead: Account-Originating Lead
  • Marketing List: Create a custom lookup (see below)
  • Product: Case-Product
  • Quick Campaign: Use the Campaign/Quick Campaign composite lookup on Campaign Response-Parent Campaign (see below)
  • Rollup Query: You can use Goal for a specific Rollup Query type, otherwise a custom lookup
  • Sales Literature: Create a custom lookup
  • Security Role: Create a custom lookup
  • User: Any owner lookup will work for this

For a custom lookup, what I mean is creating a 1:N relationship of your choice and then using the lookup field which gets generated with the relationship. For example, we could make Contact a child of Marketing Lists and then use the resultant lookup field in our dialog to allow the user to select a Marketing List.

A composite lookup is a lookup which allows the user to select a record from more than one entity. So, in the example above, the Campaign Response-Parent Campaign lookup allows the user to select from either Campaigns or Quick Campaigns.

The Customer lookup is also a special, hard-coded lookup which allows the user to select either an Account or Contact. This can also be used in a dialog if an Account/Contact is required e.g. for the client associated to a Case.

Typical Values for Sales Entities

For the sales entities we have:

  • Competitor: Custom lookup
  • Invoice: Custom lookup
  • Opportunity: Lead-Qualifying Opportunity
  • Order: Invoice-Order
  • Quote: Order-Quote

Typical Values for Marketing Entities

For the marketing entities we have:

  • Campaign: Campaign Response-Parent Campaign (also allows the selection of a Quick Campaign) otherwise a custom lookup

Typical Values for Customer Service Entities

For the customer service entities we have:

  • Article: Case-Knowledge Base Article
  • Case: Custom lookup
  • Contract: Case-Contract
  • Service: Contact-Preferred Service

Conclusions

Once explained, the configuration of a lookup response for dialogs is not too difficult. With the above examples, most dialogs can be configured without the headache of having to trawl through CRM to find the right lookup for the job.

Tuesday, January 14, 2014

TFS For CRM Development Management

Sometimes on CRM projects you get asked to do things outside of your usual routine. On my latest project I am setting up Team Foundation Server (TFS) so the development and testing teams can use it to:

  • Track the progress of a cycle of configuration, followed by a cycle of development
  • Manage the development tasks for the modules they are creating
  • Trace the individual business requirements against the development modules
  • Track the testing of the business requirements to ensure they are met as the modules are completed
  • Track issues discovered against the development modules for follow-up
  • Review who is checking in code

Previously, I had only known TFS for source control but it turns out it has been extended in the last few versions to do a lot more. I am working with TFS 2010 but, I am reliably told, TFS 2013 goes even further to make TFS the one-stop shop for development management.

What Information Can We Capture?

TFS has a number of ‘entities’ to manage development. These are:

  • Areas
  • Iterations
  • Work Items
    • User Stories
    • Tasks
    • Issues
    • Shared Steps
    • Test Cases

Areas are a bit like the Subject entity in CRM. The are used to categorize Work Items and are self-referential so an Area tree can be setup (this is done from the Team settings area of Visual Studio).

In my case I created Areas for:

  • Deleted Items: There is no obvious way to delete Work Items, so I unlink them from everything and mark them with this Area
  • Requirements: This is a category for all Work Items which define a business requirement of the system
  • Development Modules: The self-contained modules being developed for the CRM system
  • Development Tasks: The steps a developer will follow to complete a module

While I could make a hierarchy of these areas, I saw no benefit in my case and left them unlinked.

Iterations are the build cycles. In my case, I have two cycles: a configuration cycle and and development cycle. The only information we capture on the Iteration is its name and whether it is part of a hierarchy (like Areas, Iterations can be structured like a tree).

The Work Items are, in some ways similar to CRM Activities in that, while Activities are treated as a group in some ways e.g. when constructing queries, the sub-types also get individual treatment, specifically when storing information.

A User Story is something we are working to achieve with the development. So, for me, this covered two aspects: the development modules and the business requirements.

Here is the User Story form in TFS.

image

For my purposes the following fields were useful:

  • Title: To describe the development module or business requirement
  • Assigned To: To set the person building the module or the person responsible for testing the business requirement is met
  • State: For specifying where the module/business requirement testing is up to
  • Area: For classifying whether it is a development module or business requirement
  • Iteration: For specifying which cycle the module will be developed in or the cycle the requirement will be met in
  • Details: A broad description of the module or the details of the business requirement
  • All Links: This is when we link the various records together, which we will cover later

Tasks are like their namesake in CRM; they are something to do. In my case these were perfect for listing the steps in the breakdown of work for each development module.

Here is a Task in TFS.

image

Again, we have the Title, Assigned To, State, Area, Iteration, Details and Links areas, as with User Stories, but we also have:

  • Activity: which defines the kind of Task being done

image

  • Start Date and Finish Date: To define when the Task is expected to be actioned
  • Effort (Original Estimate, Remaining and Completed): To manage how the developer’s effort matches to the original estimates and to give an indication of how complete the Task is

Issues, not surprisingly, are for recording problems. In my case these are the bug reports, held against a development module for the developer to action, once testing has been performed. Here is the form.

image

This is similar to the User Story form and the fields are used in, essentially, the same way.

Shared Steps are common testing steps which can be used across multiple test processes. In my case, the testing of a business requirement required only the capture of a pass/fail with an Issue raised in the case of a failure so I did not use these.

Test Cases, surprisingly, I did not use. Mainly because, while it is possible to create a Test Case within TFS, it is not possible to create Test Case steps; these are created in Microsoft Test Manager (MTM), a separate product and automatically brought in to TFS. Given my simple test requirements, I avoided using Test Cases with the pass/fail being recorded via the Status of the business requirement.

Linking the Entities

In the case of Areas and Iterations, these have a 1:N relationship to Work Items. For the Work Items themselves, any Work Item can be linked to any other Work Item in a way similar to Connections in CRM. This means all manners of structures can be created in TFS. The key consideration in determining the right structure is working out what reports are likely to be generated from the system. In my case, the structure was like this:

image

So, for example in ‘Iteration 2’, the development iteration, we develop an SMS Module which meets the business requirements regarding the sending of SMS from the system. The tasks for the module are defined and, when the system is tested, issues are logged against the development module for the developer to action.

Within TFS, we now have a one-stop shop for the progress of development. We can open up the development module record and see all related information. By enforcing a policy of associating a Work Item to every code check-in (part of the team setup) we can also see the code being checked in from the development module record.

My Departure From the Norm

While a reasonably sensible structure, this does deviate from the ‘norm’. Generally, the development tasks come under the business requirement (User Story). For me, there were over 1,000 business requirements so this meant a lot of bookkeeping for minimal gain. The only consequence of my approach is some of the out of the box reports, which assume a certain structure, will not work quite as expected.

Reporting

There are three main approaches to reporting with TFS:

  • Queries
  • Excel
  • SSRS

Queries are quite easy to set up and work very much like Advanced Find queries. You are limited to the one entity but, for my purposes, it was sufficient.

image

From Visual Studio, you can also export queries to Excel. This option also allows for republishing back to TFS, which is great for mass-editing.

Finally, is those are insufficient, SSRS reports can be written as the information in TFS can be queried via SQL.

Conclusions

If your development team is already using TFS for source control, consider also using it for development management. The developers can remain in the products they are used to (Visual Studio and TFS) and the project manager can gain visibility of progress. Also, if you have geographically separate groups developing, this provides a common place to review progress.

Finally, I would like to thank the ‘Davids’ (David Watson and David Jansen) of Microsoft for walking me through TFS. Without their patience I would have have half the knowledge and twice the frustration with the product and their generosity of time is greatly appreciated.

Saturday, December 28, 2013

Using GIMP and the Iconator for CRM Icons

A while ago I talked about creating icons for Dynamics CRM for CRM 4 and 2011. I thought it was time for an update and some tips on creating those metro-like icons.

Tanguy’s Toolbox

Tanguy Touzard, CRM MVP and tool-maker extraordinaire has a toolbox which any developer or administrator should not be without. Here it is and it makes a whole series of common tasks so much easier. The one that is useful for icons is the Iconator.

image

Using the Iconator we can get our entities from our organization, see which ones need icons, click the ‘Add Images’ button at add our 16x16 and 32x32 images and then map them to our entities.

image

The Iconator takes care of creating our web resources for us, publish our changes and even allows us to automatically add the web resources to a pre-existing solution in our organization.

Use it and if it saves you a bit of time, feel free to click the Donate button and keep Tanguy in croissants and champagne.

Creating the Images With GIMP

GIMP (GNU Image Manipulation Program) is an open source image editor comparable to Photoshop and much cheaper (it is free). Here is the link to download it.

Once loaded, you can manipulate images like a pro, once you get used to it.

An Example of Making an Icon

Let us take a picture and convert it into a couple of CRM icons. There are plenty you can get inspiration from on the internet but, to avoid any copyright entanglements, I will use one of my own.

image

This was a photo I took at the EMP Museum in Seattle where you stand in silhouette and the screen adds horns and tentacles to you. I caught this image before it did me too much damage.

Loading it into GIMP, the first thing I want to do is eliminate the color. I can do this one of two ways; either by selecting Image – Mode – Grayscale or Colors – Hue-Saturation and put the Saturation down to 0. If GIMP complains that you can only adjust RGB images, this is set as part of the Image – Mode settings.

image

Next I am going to make it black and white. This is done with the Colors – Brightness-Contrast settings. Contrast goes to max and Brightness, as required. Below, I simply put Contrast up to the maximum value.

image

Next I will isolate the part of the picture I want for my icons with the rectangular select. This is found as the first icon in the toolbox window of GIMP. Once selected, you pick Image – Crop To Selection. Do not worry if your selection is not perfectly square; we can fix this later.

image

Next we will want the background to be transparent. To do this, we go to Colors – Color to Alpha and hit OK. Our background is now transparent.

image

We can tweak, as required, possibly invert (Colors - Invert) and when happy we adjust the size. To do this we go to Image – Scale Image and make it 32x32 px. We may need to click on the chain to break the ratio and make it perfectly square.

image

When adjusted, you will have your first icon ready.

image

To save this, go to File – Export As and save it as a png (you specify the type by simply typing in the extension e.g. ‘leon.png’). Once done, go back to the image, rescale to 16x16 px and export again. You now have two images ready for CRM.

Conclusions

Using GIMP and these simple techniques, many icons can be created from simple, readily available images. Maximising the contrast will even eliminate gray watermarks if you have an image you can use with such an artefact on it. Once created, you can add these to CRM or any other program needing icons. Their simple, flat design are also compatible with Microsoft’s metro paradigm. Good luck and feel free to explore the many features GIMP offers.

Saturday, December 14, 2013

Microsoft: Giving it the Salesforce Treatment

Regular readers will know I run the Salesforce quarterly numbers to see how Dynamics CRM’s strongest competitor is travelling. I will occasionally get asked what the numbers for Microsoft are like, using the same filters. My response is usually that Microsoft release very little information about their Dynamics CRM business but we can review Microsoft as a whole (and the Microsoft Business Division to a smaller extent).

The Numbers

For Microsoft, we go to the Microsoft Investor Relations Annual Reports site. If there is anything specific on the Dynamics division (called Microsoft Business Division) or Dynamics CRM division, this is where we will find it. This also means the data is yearly, rather than quarterly, but trends will still be apparent. The numbers and information below, unless stated otherwise, comes from the 2013-2009 annual reports.

Here are the numbers for Microsoft as a whole (in millions):

  2009 2010 2011 2012 2013
Revenue 58,437 62,484 69,943 73,723 77,849
Revenue Cost 12,155 12,395 15,577 17,530 20,249
Operating Cost 27,205 25,991 27,205 34,430 30,836
Microsoft Income 14,569 18,760 23,150 16,978 21,863
Revenue Growth # yoy   4,047 7,459 3,780 4,126
Revenue Growth % yoy   7% 12% 5% 6%
Total Cost % yoy   -2% 11% 21% -2%
Staff 93,000 89,000 90,000 94,000 99,000
Staff Growth (yoy)   -4% 1% 4% 5%
Margin 25% 30% 33% 23% 28%

Points of note are:

  • While revenues are steadily growing, costs seem to jump around a bit, specifically operating costs
  • Revenue growth is consistently positive, although much smaller than Salesforce’s
  • Staff growth is also much smaller than Salesforce’s
  • Microsoft makes a profit. Margins are consistently around 20-30% compared to Salesforce whose margin sits around –10%

For the Microsoft Business Division, of which Dynamics CRM belongs, we have:

  2009 2010 2011 2012 2013
Revenue 19,211 19,525 22,407 24,082 24,738
Implied Cost 8,058 7,416 7,940 8,279 8,549
Operating Income 11,153 12,109 14,467 15,803 16,189
Revenue Growth # yoy   314 2,882 1,675 656
Revenue Growth % yoy   2% 15% 7% 3%
Total Cost % yoy   -8% 7% 4% 3%
Margin 58% 62% 65% 66% 65%

As the only numbers in the annual report refer to the Operating Income and Revenue, we imply the cost by working out the difference.

Points of note are:

  • Consistent revenue growth but, again, smaller than Salesforce’s
  • Costs appear to be reasonably fixed which means Operating Income keeps growing and growing
  • The margin for the Microsoft Business Division is 65%. That is huge by any measure

It should be noted that the Microsoft Business Division also includes the Office products so this is obviously going to skew the numbers given the size and ubiquity of the Office suite in the business world.

Earnings Call Buzzword Bingo

Steve Ballmer does not get involved with the earnings calls, leaving it up to Chris Suh, General Manager of Investor Relations and Amy Hood, the CFO.

The latest transcript gives us the following keywords.

  • Revenue (39 times)
  • Windows (25 times)
  • Surface (17 times)
  • Devices (17 times)
  • Office (16 times)
  • Cloud (16 times)
  • Customers (11 times)
  • xbox (11 times)

It is a pity customers do not get a higher mention given they are the main thing Marc talks about in his calls. Revenue is a common theme with the two companies though. Otherwise, the usual peppering of products and services is effectively the rest of the hits.

Insider and Institutional Sales

The results here surprised me. Microsoft executives like selling stock as much as Salesforce ones.

Over the last six months, Microsoft executives have offloaded about 5% of their stock, about ten times of their Salesforce counterparts. However, it is not hard to see where the majority of this is coming from. Almost the entire amount is Bill Gates offloading his shares to raise money for the Bill and Melinda Gates foundation.

It is true that Amy Hood has offloaded about $700,000 in shares in the past six months which is comparable to Salesforce’s CFO who has offloaded about $900,000 in shares over the same period.

Institutions are also selling but not a lot. Over the last six months, institutions sold 0.13% of their holdings.

In terms of long term ownership, after a bit of digging, I found the original 1986 prospectus for Microsoft. The original executive, and their post-prospectus ownership was:

  • William H. Gates III (44.8%)
  • Paul G. Allen (24.9%)
  • Steven A. Ballmer (6.8%)
  • Jon A. Shirley (1.4%)

Of these, Bill Gates and Steve Ballmer are the only ones remaining on the executive. From Yahoo, we know Bill owns 358 million Microsoft shares and there are 8.35B shares outstanding. Therefore his ownership is now about 4%. For Ballmer, the latest transaction I can find is from 2010. At that time he owned 333 million shares which compared to 8.668B shares. Therefore, at that time, Ballmer owned about 4% of the company as well.

So, like Salesforce, the two executives have reduced their ownership of the company they work for. Given Bill is selling for his charity and Steve has resigned this is not as surprising as Salesforce’s co-founders Marc and Parker but it means we cannot cast stones too strongly.

While the executives have been selling, Microsoft has been buying. In 2008, Microsoft announced a share repurchase plan, spending $40b on share repurchases over five years, which is now complete. Share repurchases are what companies do when they have lots of cash, not many places to spend it and their share price is cheap. It demonstrates Microsoft believe in their own business and feel this is the best investment they can make for their shareholders. There is no equivalent plan in place for Salesforce, as far as I know.

Conclusions

In terms of the financials, Microsoft is making a profit and has very healthy margins and is not using non-GAAP reporting to convert losses into profits. Costs seem to be in check and there is no evidence of deterioration of the numbers. Things are not growing as quickly as Salesforce but there is no reckoning coming in terms of reining the costs in, as with Salesforce.

In terms of the buzzwords, it seems the same things that concern Salesforce, also concern Microsoft i.e. customers, revenues and their products/services.

Finally, in terms of executive commitment to the company, while the people themselves are also leaving their baby, Microsoft believes their stock is cheap as evidenced by their repurchase plan. A cynical view of repurchase plans is the company is running out of ideas to invest in but when you have fifty times the current assets of Salesforce and only ten times larger, in terms of market capitalisation, it is feasible that Microsoft may have a few bundles of cash lying around to make use of to buy shares.

Wednesday, December 11, 2013

Salesforce: The Unloved Company

It is that time again when Salesforce put out their quarterly results and I try to find the gold amongst the dirt. The title will be explained when we look at historical ownership.

The Numbers

As usual, straight from the Salesforce web site. As with the last quarterly result, the detailed financial results on their web site are out of date, nine months out of date in fact. So here is the summary, combining the different quarterly reports.

  2013 Q3 2013 Q4 2014 Q1 2014 Q2 2014 Q3
Revenue 788,398 834,681 892,633 957,094 1,076,034
Subscription Revenue 740,600 785,495 842,221 902,844 1,004,476
Revenue Cost 186,248 183,362 208,994 217,717 268,187
Operating Cost 656,338 672,126 728,179 779,234 905,778
Salesforce Income -71,150 -20,844 -67,721 76,603 -124,434
Revenue Growth # yoy 204,138 202,768 197,166 225,445 287,636
Revenue Growth % yoy 35% 32% 28% 31% 36%
Total Cost % yoy 42% 34% 31% 34% 39%
Staff 9,319 9,801 10,283 12,571 12,770
Staff Growth (yoy) 34% 26% 23% 43% 37%
Margin -9.02% -2.50% -7.59% 8.00% -11.56%

NB: A miscalculation in the revenue growth at the time of original writing has now been adjusted in the table above. Related commentary below has been lined through.

Specific points of note include revenue has broken through the $1b/quarter barrier, catching up with costs (Revenue Cost + Operating Cost) which was there last quarter. In terms of profit, Salesforce has returned to old form. With no IRS check to offset the losses, Salesforce shows a $124m loss this quarter, double the loss of the first quarter and the largest quarterly loss in the history of the company, both as a raw number and as a percentage of sales (margin).

Revenue growth (as a percentage, year on year) is the lowest it has been in over three years.Cost growth, as can be seen above is the highest since this time last year.

Revenues and Costs

Revenues are always Marc’s ‘good news story’ with Salesforce and making sales of $1b per quarter is a huge achievement. The flipside, which rarely gets Marc’s voice, are the costs. The fact is costs are outgrowing revenues unabated. In terms of the difference between the year on year percentage growth, we are now looking at a 15% 3% difference (39% – 24%36%). This is the rate of acceleration Salesforce’s costs have over its revenues. If this was a car race, not only are both cars travelling at a furious pace, and getting faster, but the costs are sailing away into the distance with revenues struggling to keep up.

That 15% differential has not been seen since the bad old days of 2011 when costs were growing at around 50% year on year.

Salesforce’s Crystal Ball

In my last quarterly report, I mentioned that Salesforce had predicted how much they would lose in this quarter and the next, predicting a loss for the year of just over a quarter of a billion dollars. Salesforce predicted, for this quarter, a loss of $111m. Unfortunately, at just over $124m, the actual loss exceeded expectation. Therefore Salesforce is on track for meeting its predict target of a loss of $257m.

Margins

The margin is the difference between what you sell something for and what it cost you to produce. Salesforce continues to struggle with this one.
image

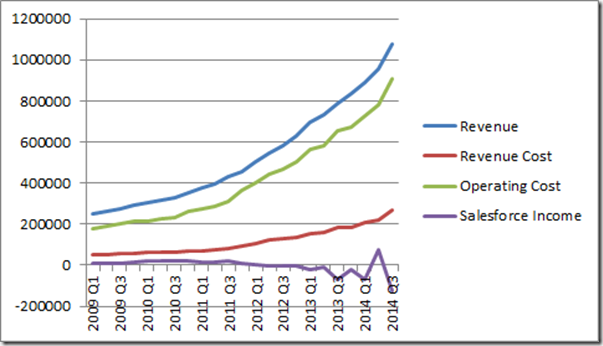
The ’Salesforce Income’ (margin) is the curve at the bottom. There are two things I do not like about this curve. Firstly, it is heading in the wrong direction. There was a time when Salesforce had profit AND growth, which is a formidable position. These days the growth is there but the profits have gone.

The second thing I do not like about it is the shape. The curve is becoming jagged instead of smooth. The last big bump is because of the IRS check but even removing this we are looking at a sawtooth rather than a steady trend. I see this and think of a tug of war between the drag of the business model and the reactive strategies of the business. For years, the business model was guiding margins on a steady, albeit undesirable, path. Now internal strategies are being used to pull the margins back into the right direction but, like a race car hitting a curve, it is resisting and wants to continue on its path.

The Salesforce apologists will argue the margin decline is not all bad and that profit is being sacrificed for continued growth. If this is the case, and this has always been the game plan, why did Salesforce spend all those years making a profit when they could have been gaining additional market share? This argument that it is ok to gain market share and not manage margin decline is one I do not buy.

Earnings Call Buzzword Bingo

Taking the quarterly transcript of CEO Marc Benioff and CFO Graham Smith we crunch the numbers to see what is on their mind compared to previous quarters.

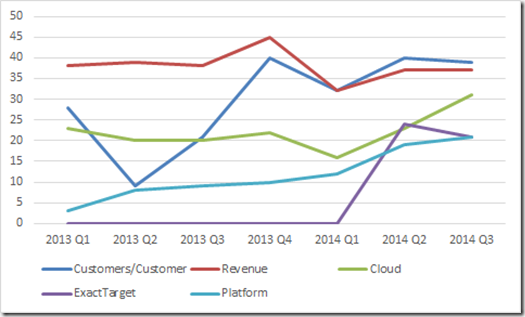
Here is a the graph for the five most popular words.
image

The topics of ‘Customer/Customers’, ‘Revenue’ and ‘Cloud’ are, of course, mainstays of Marc and Graham’s speeches. ExactTarget is a recent acquisition, which explains the sudden appearance. ‘Platform’ is an interesting one and shows a shift in the Salesforce paradigm. The platform in this case is Salesforce One, their development platform for business applications. Do not watch the video; it is full of marketing hype and tells you nothing useful. Read the web page instead. You have been warned.

In terms of other terms on the rise or decline, here is the table.

  2013 Q3 2013 Q4 2014 Q1 2014 Q2 2014 Q3
Number of words 3000 3800 2800 3500 3700
Customers/Customer 21 40 32 40 39
Revenue 38 45 32 37 37
Cloud 20 22 16 23 31
ExactTarget 0 0 0 24 21
Platform 9 10 12 19 21
Service 9 16 12 14 19
Sales 9 8 9 14 16
Growth 17 17 13 12 14
Marketing 10 9 0 12 12
Cash 9 13 10 10 10
Mobile 7 0 16 11 7
Operating 0 0 9 9 7
Enterprise 7 15 0 6 7
Social 13 9 10 9 6
EPS 0 0 7 10 5

The one that stands out for me is ‘Social’. How the mighty have fallen. Once a foundation of the Salesforce strategy, the ‘Social Enterprise’ term has gone as a result of a backlash from the not-for-profit movements which coined the term well before Salesforce tried to trademark it. ‘Mobile’ is also interesting and it will be one I keep an eye on.

Google Trends

A milestone has been reached.

image

“Dynamics CRM” as a search term is now more popular than “salesforce.com”. I must admit I have been waiting for this day for quite a while. The significance of this is not straightforward to divine. There is some art to this science in that the search terms are subjective (what about ‘salesforce’ or ‘microsoft crm’, for example).

What I think is noteworthy is that the search trend for Salesforce is not aligned to their revenue growth. Perhaps this suggests significant new revenue is not coming from new business but expanding existing business. Perhaps it suggests people are finding out about Salesforce through new channels, outside of Google. I am not sure.

Insider and Institutional Sales

Again, using Yahoo, we see that insiders have sold 0.5% of their total holdings in Salesforce over the past six months. Institutions have sold off 2.75% of their shares over the same period.

In discussing this with fellow CRM MVP and stock trading wunderkind George Doubinski, he suggested the fact that insiders are selling is neither here nor there. To put it simply, people sell shares all the time for many reasons, which I have stated in the past. He suggested we examine the change in ownership over time.

Thankfully, we have the submissions to the SEC to give us the information. For example, here is the original prospectus for Salesforce, with the original share ownership. Here are the numbers for executives which owned more than 1%.

Executive Officers and Directors: Number of Shares Percentage Ownership Before the Prospectus Percentage Ownership Before the Prospectus
Marc Benioff 28,179,071 30.9 27.8
Parker Harris 2,520,507 2.8 2.5
Magdalena Yesil 2,089,165 2.3 2.1
David Moellenhoff 1,792,005 2 1.8
Jim Steele 1,350,000 1.5 1.3
Craig Ramsey 1,300,000 1.4 1.3
Steve Cakebread 1,000,000 1.1 1

Boards change and the only original members of the board, according to the Salesforce web site, are:

  • Marc Benioff
  • Parker Harris

So how has their ownership changed in the past ten years for these founders and true-believers?

Thanks to Yahoo, we know that the major shareholders are:

Holder Shares Reported
BENIOFF MARC 10,212,500 Dec 28, 2012
RAMSEY CRAIG 1,384,584 Nov 26, 2013
HARRIS PARKER 9,419 Nov 29, 2013
ROBERTSON SANFORD 172,800 Nov 26, 2013
HASSENFELD ALAN G 116,000 Nov 26, 2013

So Marc has gone from 28 million shares down to 10 million shares and Parker has gone from 2.5 million shares down to 9,000. How does this compare to the total number of shares? Well, we know that Marc’s holding of 28,179,071, at the time of the prospectus represented 27.8% of all shares. Therefore, maths tells us the total number of shares was around 101,363,564 (let’s call it 101 million).

Looking at the last annual report (before the recent 4:1 share split) we see that as of January 31, 2013 there were 147m shares outstanding. It is possible the values for all major shareholders, except Marc are in the new split shares but we will err on the side of caution and assume not.

Running the numbers, this means Marc Benioff has gone from being a 28% owner of the company in 2004 to being a 7% owner of the company (10,212,500/146,406,655) today. In the case of Parker Harris, he has gone from owning 2.5% of Salesforce to owning essentially no part of the company.

If Marc and the executive are so positive about Salesforce, why do they own so much less than they did when they floated the company? Why do many of the executive continue to sell their holdings on practically a daily basis? It is for this reason that I refer to Salesforce as unloved. For whatever reason the father(s) of Salesforce are abandoning their baby. This being said, I am sure Salesforce will never be an orphan. With Salesforce and Oracle building closer and closer ties, if Marc sets his baby free, there will be Larry Ellison with open arms to welcome it into the Oracle family.

Conclusions

As is often the case with the quarterly reports, I find myself writing the conclusion with mixed emotions. I like Salesforce and I like the competition is brings to the market. It brought innovation and life to a stagnating CRM industry and it pains me to see dark clouds on the horizon.

Regardless of how Salesforce juggle the numbers for their non-GAAP reporting, eventually the piper must be paid and a real profit must be made. I see no indication that Salesforce plan to do this in the near future and this concerns me greatly. Perhaps this new platform play, emphasizing the development tools over the SaaS offerings will be the key. It seems Salesforce is trying to be the appstore for business applications, which is an interesting play. If they get the adoption, this will make them formidable, in the same way that the sheer volumes of applications for Apple is a sustainable competitive advantage which the others struggle to assail.

The Google trends result is interesting. The graph clearly shows people are not asking about Salesforce via Google as much as they once did. This surprises me in that the revenue growth would suggest increasing popularity, not decreasing. Perhaps Salesforce will, once again, release subscription numbers in the future and we can see how this correlates to these seemingly contradictory results.

Finally, we have the result of the executives and their seemingly waning affection for their creation. Perhaps they are moving on to other things. Perhaps they really need the money. Again, whatever the reason my hope is Salesforce continues with or without their support.

Friday, November 29, 2013

A Codeless Rollup Field

I owe this tip to my fellow CRM partner-in-crime, Oakton Canberran Julie Stedman who discovered it on a project we are working on. It works for both CRM 2011 and CRM 2013.

The Problem

Often a client asks to roll up the number of child records to a parent record or, perhaps, roll them up and split them by status. An example may be enrolments for a course. On the course record we want to see the number of enrolments and whether the attendees have paid.

Traditionally, we add a field to the parent record and use a plugin to query CRM to populate the value in the field. However, there is another way.

The Solution

A little-known property of adding a sub-grid to a form is the ability to only show a chart instead. This means we can add a bar chart or pie chart to a record showing totals for the child records. Scroll down to the bottom on the sub-grid properties for the magic tickbox to ‘Show Chart Only’.

image

That is it. With this ticked, instead of a grid showing, you see a chart which represents whatever related data you desire. Here is an example where I have added the chart to a Case record to summarise the associated activities.

image

The only drawback with this is you cannot drill down into the chart but, for rollup totals, this is probably not the end of the world.

Conclusions

For a quick and elegant way to show rollup totals of child records on a parent record, consider this trick. You still have the power to configure the look and feel of the chart(s) and you avoid adding a bunch of fields and populating them via plugins which can be time-consuming and, therefore expensive.

Sunday, November 24, 2013

Review: Surface 2 32G (Why I Am Shocked How Good It Is)

I write this as I return to Sydney, Australia, after attending another great MVP Summit. Sometimes Summit can be frosty, depending on how the previous 12 months have been but this was not one of them. This was a ‘good’ summit and thoroughly enjoyable. In fact, it was probably the best I have attended.

clip_image002

One of the ‘thank you’s Microsoft threw the way of the MVPs at this Summit was a discounted Surface 2 32Gb. I have a Surface Pro and have done a few reviews on it. (here and here).

I did not see the need to get a machine that ran Windows RT, as opposed to a full version of Windows, but my wife needed a machine that was more portable than her large Dell laptop. After showing her the Surface 2 in a local electronics store, she agreed the Surface 2 would meet her needs.

I purchased the Surface 2 and, being tech support for the family, set it up under my account (I did not have my wife’s Windows login and password at the time) to see how it works.

My Fears

The original Surface RT was a clear play against the iPad; it ran an efficient non-Intel chip and ran apps rather than ‘standard’ Windows software. My thinking was I needed a ‘real’ laptop-like device and the Surface Pro fit the bill. As mentioned, in my previous review, the Surface Pro is more comparable to a MacBook Air than an iPad, based on its specifications and functionality.

Also, Windows RT will not run legacy software. I did not want to be in a position where I could not run an essential program (whatever that might be) so buying the Surface Pro was erring on the side of caution.

While it was not important to me, the non-Pro versions do not support a digitized stylus so they are limited in their use as, say, a drawing implement, without an external writing pad.

Finally, the original Surface RT had a lack of Outlook support. I live in Outlook and this was a deal breaker.

So, at the end of February, at the previous Summit, I opted for the biggest, most powerful, Surface Pro I could get, the Surface Pro 128. It did everything I needed and I still use it at home, work and in-between.

Why My Fears No Longer Apply

Every excuse I made not to buy the original Surface RT do not apply to the Surface 2. Here are the reasons I no longer want to give the Surface 2 to my wife and keep it for myself (which is never going to happen, by the way. She deserves the best and the Surface 2 comes pretty close).

Outlook Support

The Surface 2 comes with Microsoft Office for free, including Outlook. Often, when I told people the reason I do not have an iPad was a lack of Outlook support, they would tell me ‘but it has a mail app’, which, of course, it does, but Outlook is so much more than this. Outlook is a one-stop shop for my emails, calendar and RSS feeds. I can link to two Exchange boxes (my Office 365 Exchange and my work Exchange), send emails from either, consolidate my calendars and so much more. The mail and calendar apps of the iPad seem awkward and clumsy in comparison. I was fearful the Surface 2 version of Outlook was going to be a cut down, pale imitation, of the ‘proper’ Outlook but this is not the case.

clip_image004

Everything I need from Outlook is there, without compromise, with the default settings optimized for the Surface. The only thing I have not tried to install is TwInbox, which I use to bring Twitter into Outlook, but there are plenty of Twitter monitoring tools out there, if required.

Legacy Software Support

Here is a screenshot of my Surface Pro taskbar with the programs I most frequently use, roughly in order of popularity.

clip_image006

For all of these, I can either run them on the Surface 2, or work around the issue without too much compromise.

  • Internet Explorer: It is there and appears to have both flavours (Metro and Desktop)
  • File Explorer: Available
  • Firefox: I cannot find it in the store but, as long as Internet Explorer does not flake out, I will not need it
  • Chrome: See Firefox
  • Outlook: Available
  • Word: Available
  • OneNote: I have found the touch-optimised Metro version which connects seamlessly to my SkyDrive OneNote Notebooks
  • PowerPoint: Available
  • Excel: Available
  • Project: It does not appear to be available but I only use it for work, and infrequently, so it is not a show-stopper for me
  • Live Writer: Not available (see below)
  • Snipping Tool: Available
  • Calculator: Available
  • Skype: Metro version available
  • Tree Size: Metro version available
  • Remote Desktop Connection: Available
  • SureStep: Almost certainly not available as a download for RT, but is available online, which is good enough
  • Adobe PDF Reader: The Metro Reader app can display PDFs
  • Notepad: Available
  • Microsoft Money 94: Not available (see below)
  • Zune: Available through updates in Windows 8.1 apparently (not yet tested)

For Microsoft Money 94, while it does work on the Surface Pro (although if you try to tap with the stylus it crashes), it will not work with the Surface 2. I use Microsoft Money to keep track of some stocks that I own. It works really well for this but, being almost 20 years old, it is probably time to find an alternative. Looking at the options in the Microsoft Store, Yahoo Finance seems to be a good replacement and available for the Surface 2.

After two days of using the Surface 2, the only other program which caused me grief was a lack of Live Writer support. You cannot install Windows Essentials and, therefore, the excellent blog-writing tool, Live Writer is not available on the Surface 2.

Searching on the internet I could not find a solution to this until I dug around in the Surface 2’s version of Word 2013. Under the ‘Share’ option in the File menu is a ‘Post to Blog’ option which it claims, like Live Writer, supports Blogger, the home of my blog.

clip_image008

Unfortunately it turns out not to be true. I tried my hardest to register Word with Blogger but it refuses. I even created a new gmail account, added it as an author to my blog and tried that instead without success. Therefore I was forced to use Live Write on my Surface Pro to get the blog out of the door. Hopefully Microsoft will fix this bug but if not I either move to a different blog host or stick to my Surface Pro with Live Writer.

Hard Drive Size

The 32Gb solid state drive is quite a drop from my Surface Pro’s 128Gb drive and, after the operating system took its share, there was about 18Gb remaining. Fortunately, Windows 8.1 comes with its own version of Dropbox in the form of the integrated SkyDrive directory. Everything in your SkyDrive account is visible but you choose what is synchronised to the local drive. Therefore, the need to store local files is greatly reduced and anything that is put on the drive, such as photos through the camera, can be transferred to SkyDrive, freeing up the local drive.

After configuring Outlook, which is keeping a local copy of the previous month’s emails and appointments, I have about 14Gb spare.

clip_image010

As with my Surface Pro, there is also the MicroSD slot on the back of the machine if I need to boost the local storage.

Other Reasons to Consider a Surface

The first reason is the Microsoft Store customer service is outstanding. I reported, in my previous review, the dodgy ‘c’ key on my Type Keyboard. Being back in Seattle, I had the opportunity to take the keyboard back to the Microsoft Store in the hope of exchanging it. I was a little concerned as I had no receipt and it had been nine months.

Going to the Bellevue Microsoft Store I was informed that, while they would be happy to exchange, the popularity of the Type Keyboard meant they were out of stock and could only offer me a Touch Keyboard, which I declined. I noticed that Seattle also had a couple of Microsoft Stores; one in the University district, which was a little out of my way, and another ‘speciality store’, at Pacific Place, near the corner of Pine and 6th in downtown. The speciality store turned out to be a small booth. Even though this was the case, they had stock and Chad was more than willing to exchange. Again, unfortunately, they had run out of the original Type keyboards so, instead, he replaced it with the new edition of the Type keyboard with backlighting. All keys are working like a charm and I can type on the flight back to Sydney, without the overhead light on, letting my fellow passengers get a good rest.

My only criticism of the keyboard is that while the keys are backlit, the touchpad is not, which means you must resort to feeling around the keyboard to find it. Given the original keyboard had no backlighting at all, it is still a great improvement.

The second reason to consider a Surface 2 is the battery life. The efficient CPU used in the Surface 2 machine means it gets much longer battery life than my Surface Pro. I have not had the opportunity to fully test this yet but I have read battery life estimates of nine hours (compared to four with my Surface Pro and around six with the Surface Pro 2).

The final reason is the freebies you get with the Surface 2. Firstly, there is a Skype offer, which appears to give a year’s worth of free international calls, although I have not activated it yet. Secondly, you get 200Gb of SkyDrive storage free for two years. I was looking for somewhere to store my photos where they would be easily accessible (ADrive is great but it is hard to review the photos stored there). SkyDrive is ideal as I can load all my photos up there and share the drive with my family and friends, as needed.

Conclusions

I bought the Surface 2 thinking it was a ‘wannabe laptop’; the laptop you have when you do not have a laptop, but I was completely wrong. Even for a power user such as myself, the Surface 2 provides everything I need (well, except the ability to publish blogs but I will see if I can get around this). While it will be of limited use for people who work heavily with legacy programs, for me, it does the job. The programs I use every day are here and, while it only has 2Gb of RAM I notice no significant difference in speed between it and my Surface Pro with double the memory and a much more powerful processor. I am sure my wife will be very happy with her new Surface 2.